Using the OpenROAD Dashboard to track and analyze Quality of Results#
The metrics dashboard (https://dashboard.theopenroadproject.org/) is tailored for RTL-to-GDS flow stages, targeting different designs across various platforms. The dashboard comprises two main pages: the trends page and the comparison page.
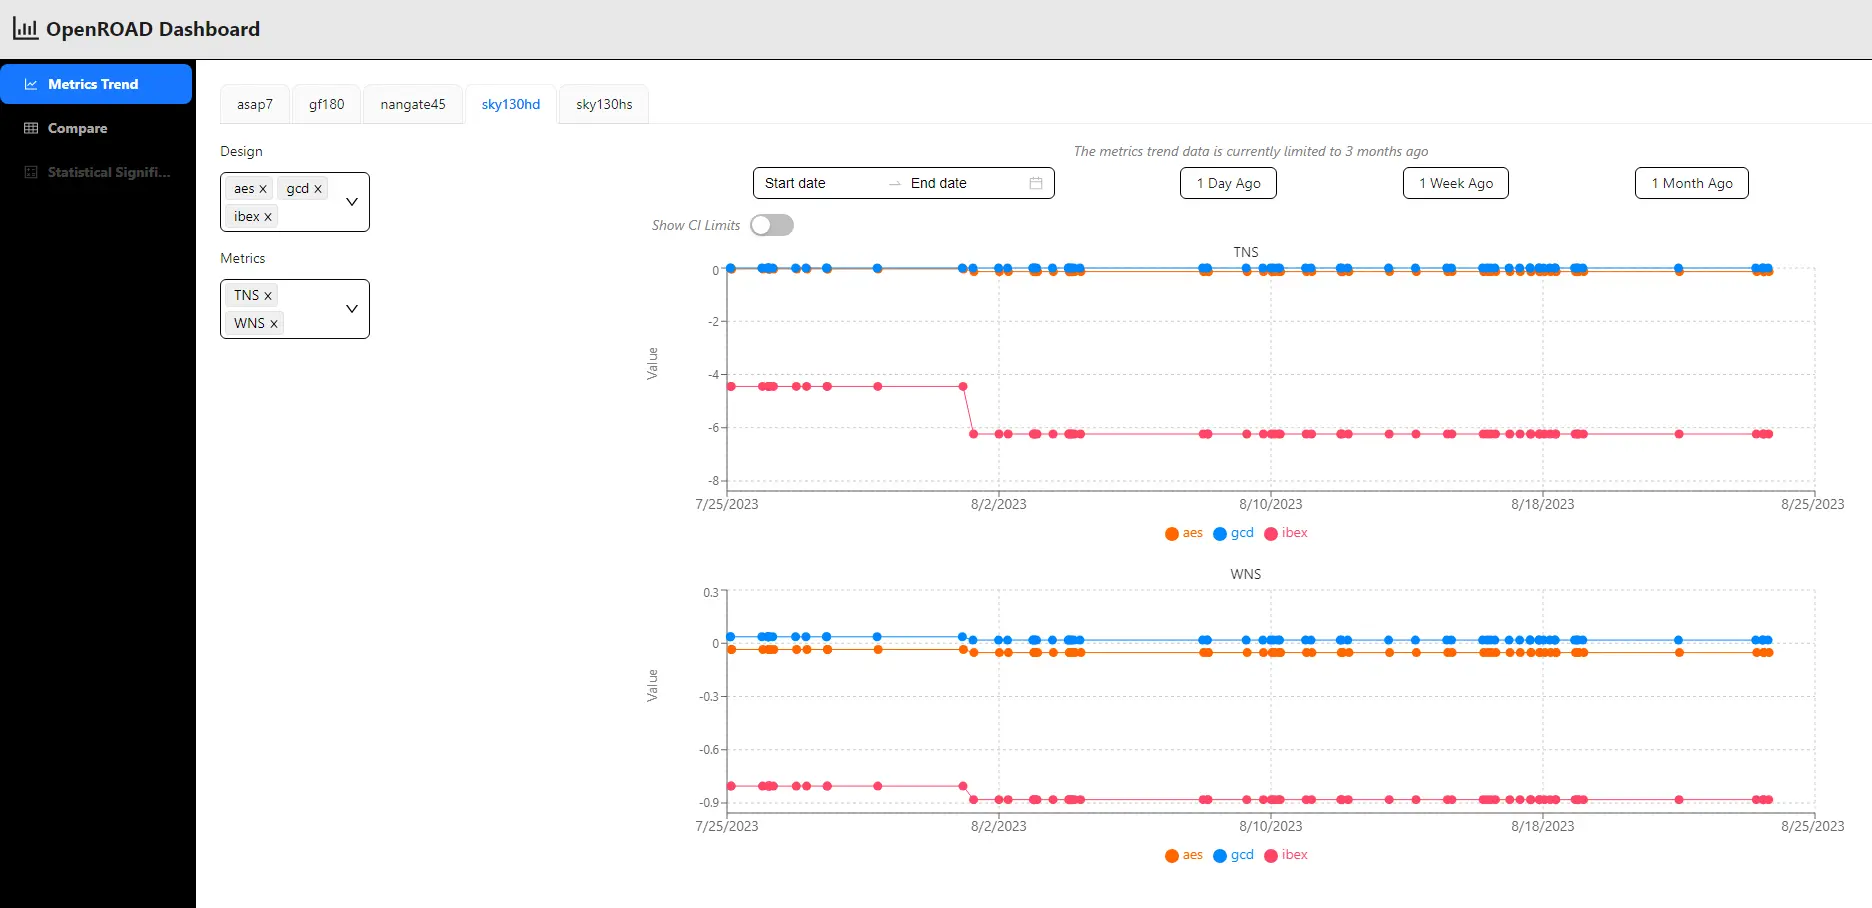
Trends#
The trends page allows users to visualize metric trends through interactive graphs, enabling the selection of platforms, designs, and metrics for each platform. This feature aids in tracking the fluctuations of metrics over time.
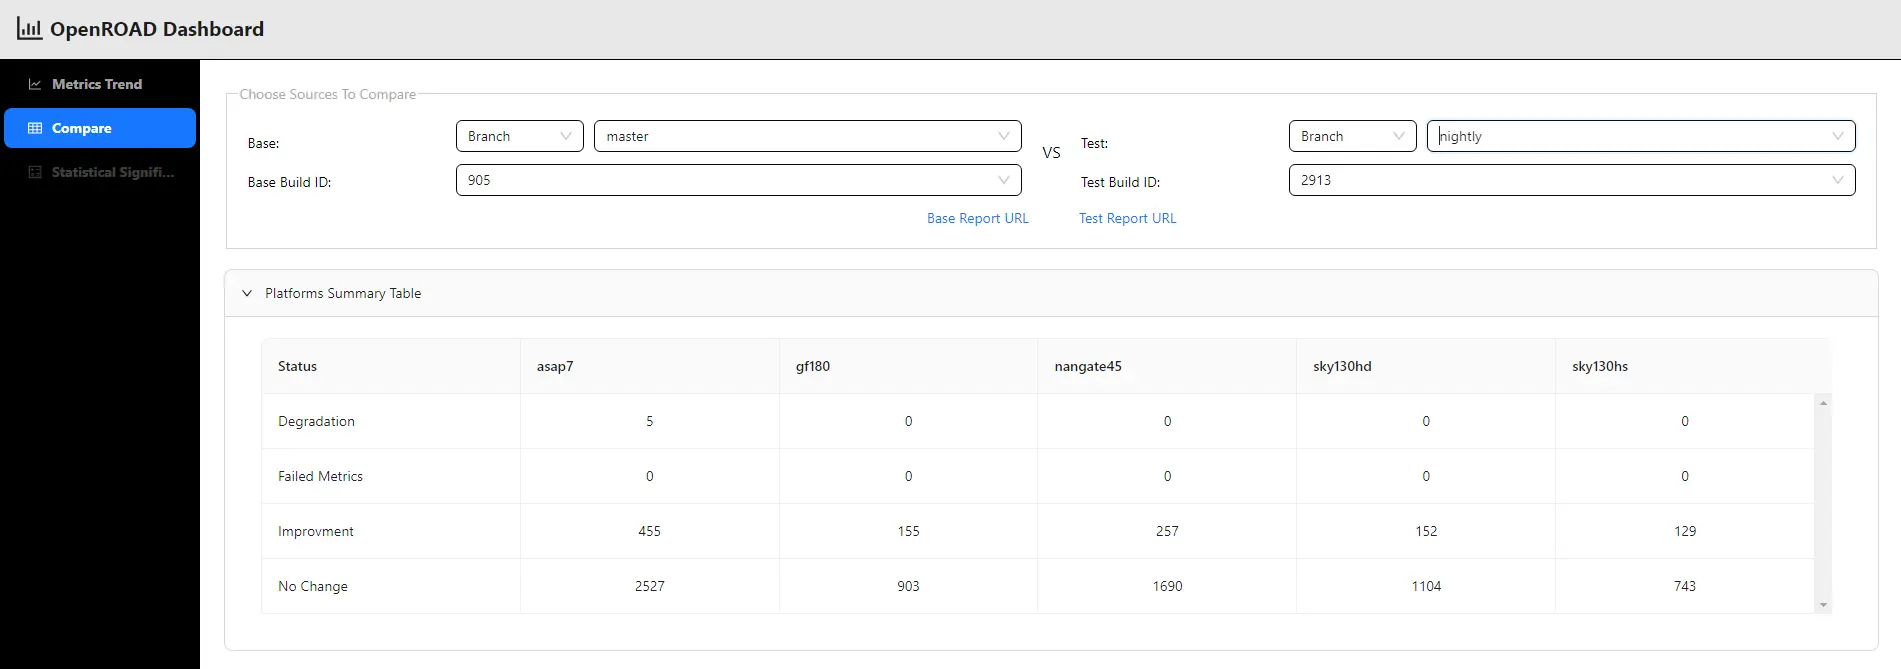
Comparison#
The comparison page lets users compare metrics between branches or commits for a specific platform and its designs. The comparison is shown as a table showcasing the differences between the base source and the test source. This page also offers deeper insights, like the platform summary table that presents statistical trends for different designs within a platform and a summary table that provides insights for the set of selected designs, with added functionality for filtering.
These pages combine to create a comprehensive dashboard facilitating data-driven decision-making and performance optimization in the design flow.